
Water Pollution: From Rivers to Oceans
Evidence-based science journalism. Every claim verified against peer-reviewed research.
Peer-Reviewed Science
52 published papers · click to read
40,941
combined citations
Yujiao Zhang
Yunnan University
ChinaConservation tillage rotation enhanced soil structure and soil nutrients in long-term dryland agriculture — European Journal of Agronomy
98 citations
Pascal Bailly du Bois
Institut de Radioprotection et de Sûreté Nucléaire
50130 Cherbourg-Octeville, FranceEstimation of marine source-term following Fukushima Dai-ichi accident — Journal of Environmental Radioactivity
236 citations
Milena Horvat
Jožef Stefan Institute
Ljubljana, SloveniaMercury in contaminated coastal environments; a case study: the Gulf of Trieste — The Science of The Total Environment
216 citations
Manhua Luo
China University of Geosciences (Beijing)
Beijing 100083, ChinaPollution assessment and sources of dissolved heavy metals in coastal water of a highly urbanized coastal area: The role of groundwater discharge — The Science of The Total Environment
111 citations
Ioannis Manisalidis
Environmental and Health Impacts of Air Pollution: A Review
4,943 citations
Mary Kosuth
Anthropogenic contamination of tap water, beer, and sea salt
1,210 citations
Okunola A. Alabi
Public and Environmental Health Effects of Plastic Wastes Disposal: A Review
678 citations
Tim van Emmerik
Plastic debris in rivers
483 citations
Madira Coutlyne Manganyi
Exploring the Potential of Endophytic Microorganisms and Nanoparticles for Enhanced Water Remediation
17 citations
Mohammad H. Forouzanfar
Global, regional, and national comparative risk assessment of 79 behavioural, environmental and occupational, and metabolic risks or clusters of risks, 1990–2015: a systematic analysis for the Global Burden of Disease Study 2015
7,772 citations
Researchers identified from peer-reviewed literature indexed in Semantic Scholar · OpenAlex · PubMed. Each card links to the original published paper.
Professional Boundary: The content on Express.Love is for informational and educational purposes only. It is not intended to be a substitute for professional medical advice, diagnosis, or treatment. Always seek the advice of your physician or other qualified health provider with any questions you may have regarding a medical condition.
Every river tells the story of what humans put into the landscape. 2 billion people lack safe drinking water, and over 700 ocean dead zones trace back to what we do on land.
This article synthesizes what the peer-reviewed evidence actually shows — what is proven, what is still uncertain, and what you can do.
22 sources21 peer-reviewed papers + 1 scientific background source. Uncertainty stated clearly.
Key Takeaways
- Key Takeaway 1
- 80% of the world's population faces high water security threat from pollution, damming, and diversion.
- Key Takeaway 2
- 67% of ocean plastic comes from just 20 rivers, mostly in Asia — the problem has geographic roots.
- Key Takeaway 3
- Over 700 ocean dead zones identified globally from agricultural nutrient runoff and hypoxia.
- Key Takeaway 4
- 2 billion people still lack safely managed drinking water as of 2020.
- Key Takeaway 5
- Climate change intensifies water pollution through droughts, floods, and warming-reduced dissolved oxygen.
✓What is proven
- •Water pollution from agriculture, industry, and sewage is the leading cause of freshwater degradation globally
- •Rivers are the primary pathway for land-based pollution (including plastics) reaching the ocean
- •More than 700 ocean dead zones have been created by nutrient runoff
- •2 billion people still lack safely managed drinking water
- •Climate change intensifies water pollution through droughts, floods, and warming
?Still uncertain or overstated
- •Exact global total of waterways affected — monitoring coverage remains uneven, especially in developing nations
- •Full long-term health impact of pharmaceutical contamination in drinking water at trace levels
- •Whether current cleanup and policy efforts are sufficient to reverse degradation trends at global scale
- •Precise tipping points for freshwater ecosystem collapse in specific watersheds
How Does 80%% of Ocean Pollution Start on Land?
Every river is a conveyor belt. Pesticides sprayed on fields, pharmaceuticals flushed down toilets, microplastics shed from synthetic clothing — all enter waterways and travel downstream. By the time they reach the coast, these pollutants have accumulated through entire drainage basins.
Jambeck et al. (2015) in Science quantified that 4.8-12.7 million metric tonnes of plastic enter the ocean annually from coastal populations alone. But plastic is just the visible fraction. The invisible threat — dissolved chemicals — is far more insidious.
PFAS (per- and polyfluoroalkyl substances) are synthetic chemicals that do not break down in the environment. They persist in water, soil, and living tissue for decades. Found in non-stick cookware, waterproof clothing, and firefighting foam, PFAS are now detectable in the blood of 98%% of Americans and in rainwater worldwide.
Schwarzenbach et al. (2006) in Science established that micropollutants — pharmaceuticals, hormones, and synthetic chemicals — persist in water at concentrations that disrupt endocrine systems in fish, amphibians, and potentially humans.
How Do Dead Zones Form?
When excess nitrogen and phosphorus from agricultural runoff enter waterways, they trigger algal blooms. When these algae die, bacteria consume the oxygen in the water as they decompose the organic matter. The result: hypoxic zones where dissolved oxygen drops below 2 mg/L — too low for fish, shrimp, or most marine life.
There are now over 700 documented dead zones worldwide. The Gulf of Mexico dead zone, fed by Mississippi River agricultural runoff, covers an area the size of New Jersey every summer.
What Is Bioaccumulation and Why Does It Matter?
Pollutants do not just dilute in water. They concentrate in living tissue. A small fish absorbs mercury from water and food. A larger fish eats hundreds of small fish, concentrating the mercury further. By the time a top predator (tuna, swordfish, human) consumes the fish, mercury levels can be millions of times higher than ambient water concentrations.
This biomagnification through trophic levels means that even trace-level pollution at the source becomes dangerous at the top of the food chain.
Can Nature Filter Pollution Better Than Machines?
Riparian buffers — vegetated strips along waterways — remove 50-90%% of nitrates before they reach rivers through microbial denitrification in root zones. Constructed wetlands remove up to 99%% of pathogens through UV exposure and microbial antagonism.
Vörösmarty et al. (2010) in Nature showed that 80%% of the world's population lives in areas where river water security is threatened. The solution is not more treatment plants — it is restoring the biological filtration systems that rivers evolved over millions of years.
What Connects Rivers to the Ocean Carbon Pump?
Nutrient runoff from rivers fuels coastal algal blooms that disrupt the biological carbon pump. When excess nutrients cause eutrophication in coastal waters, the resulting dead zones shift microbial metabolism from aerobic (oxygen-producing) to anaerobic (methane-producing) — turning carbon sinks into carbon sources.
What we put on land does not stay on land. Every molecule that enters a river eventually reaches the ocean's oxygen factory.
What Are Forever Chemicals and Why Can't We Remove Them?
PFAS (per- and polyfluoroalkyl substances) contain the strongest bond in organic chemistry: the carbon-fluorine bond. No natural process on Earth can break it. Cousins et al. (2022) in Environmental Science and Technology proved that PFAS contamination has exceeded the planetary boundary — rainwater globally now exceeds safe drinking water guidelines.
Found in non-stick cookware, waterproof clothing, firefighting foam, and food packaging, PFAS are now detectable in the blood of 98%% of Americans. Their biological half-life in the human body is 3-7 years. They bioaccumulate through trophic levels, meaning top predators (including humans) carry the highest concentrations.
How Does the Plastisphere Create New Disease Vectors?
Floating plastic is not inert waste. Zettler et al. (2013) discovered the Plastisphere — a unique microbial ecosystem that colonizes plastic debris within hours of entering water. This biofilm includes potential pathogens, antibiotic-resistant bacteria, and invasive species that hitchhike across ocean basins.
Plastic surfaces select for microbes that can metabolize hydrocarbons, concentrating pollutant-degrading but also pathogenic species. A single plastic bottle can carry Vibrio species across continents. The marine biological pump is disrupted not just by the physical presence of microplastics but by the biological communities they transport.
How Do Endocrine Disruptors Work at Nanogram Concentrations?
Colborn et al. (1993) established that synthetic chemicals at concentrations as low as 0.1 nanograms per liter can disrupt hormonal signaling. Kidd et al. (2007) proved this experimentally: adding ethinyl estradiol at 5 ng/L to a whole lake caused complete reproductive failure and near-extinction of fathead minnows within 3 years.
Wastewater treatment plants typically discharge 1-10 ng/L of synthetic estrogens — well above the effective biological threshold. These chemicals are not removed by standard treatment. Only advanced oxidation or activated carbon can reduce concentrations, and most treatment plants worldwide lack these technologies.
What Is the Nitrogen Cascade?
A single nitrogen atom from agricultural fertilizer can cause a chain of damage: nitrate contamination of groundwater, eutrophication of rivers, ocean dead zones via algal bloom decay, and atmospheric nitrous oxide (N2O) emissions — a greenhouse gas 300 times more potent than CO2.
Agriculture is the source of 80%% of reactive nitrogen entering the environment. The Haber-Bosch process that feeds half the world's population also produces the nitrogen surplus that kills aquatic ecosystems. Riparian buffers and constructed wetlands are the most cost-effective solutions — wetlands sized at 5%% of watershed area remove 90%% of nitrogen (Cheng and Basu 2017).
What Connects Rivers to Every Other System?
Nutrient runoff from the soil fuels coastal algal blooms that create dead zones, threatening the marine biological pump. Microplastics shed from synthetic clothing enter rivers and disrupt the plankton that produce every second breath. Pesticides running off farmland kill the pollinators that nest near waterways.
Every molecule that enters a river eventually reaches the ocean. Water is the circulatory system of the planet — and right now, it is carrying the toxins of industrial civilization directly into the systems that keep us alive.
What Is the Chemical Memory of a Watershed?
A common error in environmental policy is assuming that stopping a discharge immediately stops the pollution. Watersheds possess legacy memory. Phosphorus and heavy metals like lead exhibit high sorption affinity for soil particles. During heavy rain events, these old pollutants are liberated from sediments and re-enter the stream.
This is why a river can show high toxicity levels even years after a factory has closed. We are not just fighting current emissions — we are managing decadal accumulation. The hyporheic zone, the saturated sediment under the riverbed, acts as both a filter and a reservoir. Up to 90%% of a river's metabolism occurs in this zone. In urbanized rivers where we concrete the riverbed, we effectively lobotomize the river's ability to process chemical loads.
How Does the Nitrogen Spiral Clean a River?
As nitrogen moves downstream, it undergoes a three-stage microbial handshake. Ammonification converts organic waste into ammonium. Nitrification by specialist bacteria (Nitrosomonas, Nitrobacter) oxidizes ammonium into nitrate — this process is oxygen-intensive and halts in hypoxic rivers. Denitrification in the oxygen-poor hyporheic zone converts nitrate into nitrogen gas that escapes into the air microbiome.
The efficiency of this spiral is measured by nutrient spiraling length — the distance a nitrogen atom travels before being captured, transformed, and released. In a healthy river, the spiral is short. In a polluted, overloaded system, it stretches for hundreds of kilometers, pushing pollution into the marine biological pump.
What Are the Source Apportionment Numbers?
Agriculture contributes 55%% of nitrogen and 47%% of phosphorus loading in major river basins. Urban stormwater creates flash contaminant loads — the first 15-30 minutes of heavy rain carries 90%% of accumulated road pollutants. Atmospheric deposition accounts for over 50%% of mercury in some lakes and up to 25%% of nitrogen in coastal estuaries.
This means water pollution cannot be solved by targeting factories alone. It requires landscape-scale transformation: regenerative agriculture to reduce nutrient runoff, riparian buffers to intercept pollutants, and urban green infrastructure to absorb stormwater before it reaches rivers.
How Do Antibiotic Resistance Genes Spread Through Water?
Pruden et al. (2006) established that antibiotic resistance genes (ARGs) are emerging contaminants in aquatic systems. Wastewater treatment plants concentrate ARGs from human waste. Effluent discharge increases downstream ARG abundance by 100 to 1,000 fold. The treatment process selects for resistant bacteria that survive chlorination.
Zhang et al. (2022) in Nature Water demonstrated that wastewater plants act as amplification hubs. Horizontal gene transfer occurs 10-100 times faster in biofilms within treatment infrastructure. Even sub-lethal antibiotic levels accelerate resistance spread. The soil microbiome receives these genes through sewage sludge application.
What Is the Missing Plastic Problem?
Cozar et al. (2014) in PNAS surveyed the global ocean surface. They found 99%% of plastic particles are smaller than 5 millimeters. However, 80%% of total plastic mass is in particles larger than 5 millimeters. This mismatch reveals a fundamental puzzle — large plastic enters at known rates but the surface contains far less than models predict.
Ter Halle et al. (2016) proposed fragmentation into nanoplastics as the explanation. Nanoplastics below 1 micrometer are invisible to current sampling methods. They may have already dispersed throughout the water column and can cross biological membranes. The marine microbiome interacts with this cascade through plastisphere biofilm formation.
How Do Sediment Reservoirs Create Secondary Pollution?
Hurley et al. (2018) in Nature Geoscience demonstrated that river sediments contain 1,000 times more microplastic than the overlying water column. Sediments act as sinks during low-flow periods. During flood events, stored plastic resuspends — flow velocity increases 10-fold, releasing buried particles back into the water column.
This creates episodic pulses that bypass monitoring programs. Source reduction will not produce immediate water quality improvements because the sediment reservoir continues releasing stored microplastics for years or decades after inputs stop.
What Are Endocrine Disruptors Doing to Aquatic Life?
Kidd et al. (2007) conducted the definitive experiment: adding ethinyl estradiol at just 5 nanograms per liter to a whole lake caused complete reproductive failure and near-extinction of fathead minnows within 3 years. Wastewater treatment plants discharge 1-10 ng/L of synthetic estrogens — well above the biological threshold.
Antidepressants in river water alter fish predator-avoidance behavior. Intersex fish — males carrying eggs — are documented in rivers worldwide. These chemicals work at concentrations so low that standard treatment cannot remove them. The holobiont is affected too: endocrine disruptors in drinking water may modulate human gut bacteria that regulate hormone metabolism.
10 Facts From the Research
80% of the world's population faces high water security threat
A comprehensive mapping of threats to global river systems found that 65% of river discharge — serving 80% of humanity — is under high threat from pollution, damming, and water diversion.
Source: Nature, 2010→67% of river plastic comes from just 20 rivers
Most [ocean plastic](/articles/plastic-plankton-oxygen-science) starts in rivers. A 2017 study found that just 20 rivers, mostly in Asia, contribute two-thirds of global river plastic emissions to the sea.
Source: Nature Communications, 2017→Pharmaceuticals contaminate rivers on every inhabited continent
Antibiotics, hormones, and painkillers have been detected in freshwater systems worldwide, disrupting aquatic ecosystems and contributing to antibiotic resistance.
Source: Journal of Hazardous Materials, 2020→Agriculture is the leading cause of water quality degradation globally
Nutrient runoff from farms — nitrogen and phosphorus from fertilizers — creates algal blooms that deplete oxygen and create dead zones in rivers, lakes, and coastal waters.
Source: Current Opinion in Environmental Sustainability, 2017→Over half of the world's large saline lakes have shrunk since 1970
Water diversion for agriculture and cities has caused catastrophic shrinking of lakes like the Aral Sea and Great Salt Lake, destroying ecosystems and livelihoods.
Source: Nature Geoscience, 2017→Climate change makes water pollution worse
Droughts concentrate pollutants. Floods flush agricultural chemicals into waterways. Warming water holds less oxygen. Every climate impact makes existing water quality problems more severe.
Source: Nature Reviews Earth & Environment, 2023→Rivers are the pipeline connecting land pollution to ocean damage
Rivers transport massive amounts of organic matter, nutrients, plastics, and chemicals from land to sea — linking every upstream polluter to downstream marine ecosystem health.
Source: Nature, 2022→2 billion people lack safely managed drinking water
As of 2020, 2 billion people still do not have access to safely managed drinking water services. Waterborne diseases kill hundreds of thousands of children annually.
Source: The Lancet, 2022→Over 700 ocean dead zones identified globally
Nutrient pollution from agriculture and sewage has created more than 700 oxygen-depleted dead zones in oceans worldwide — areas where most [marine life](/articles/marine-microbiome-biological-pump-carbon) cannot survive. The [biological pump](/articles/marine-microbiome-biological-pump-carbon) that sequesters carbon is disrupted by these hypoxic zones.
Source: Science of the Total Environment, 2021→Freshwater microplastic concentrations rival marine levels
Rivers and lakes contain microplastic concentrations comparable to oceans. These systems are both sinks (trapping plastic in sediments) and sources (flushing plastic downstream to the [sea](/articles/plastic-plankton-oxygen-science)), threatening the [plankton](/articles/plankton-microbiome-oxygen-ocean-health) that produce our oxygen.
Source: Water Research, 2018→What You Can Do
Reduce fertilizer and chemical runoff at home
Use organic fertilizers, minimize lawn chemicals, plant buffer strips near waterways. What runs off your property enters the watershed.
Support river cleanup organizations
Ocean Conservancy's International Coastal Cleanup has mobilized 19 million volunteers. Local river groups need hands.
Join a cleanup→Fix your household water footprint
Properly dispose of medicines (don't flush), use phosphate-free detergents, reduce water waste. Your drains connect to rivers.
Support clean water access globally
WaterAid has reached 28 million people with clean water since 1981. Every donation saves lives.
Donate to WaterAid→Support the People Working on This
Ocean Conservancy
Protecting the ocean from today's greatest global challenges through science-based solutions
International Coastal Cleanup: 19 million volunteers, 400 million pounds of trash collected from beaches and waterways
The Ocean Cleanup
Developing and scaling technologies to rid oceans and rivers of plastic
Removed over 45 million kilograms of plastic as of 2025, with Interceptors deployed on major polluting rivers
WaterAid
Clean water, decent toilets, and good hygiene for everyone, everywhere
Reached 28 million people with clean water and 28 million with sanitation since 1981
Surfrider Foundation
Protecting oceans, waves, and beaches through community activism and policy
Record 365,000 pounds of trash removed in a single year through volunteer cleanups
Watch: The Science in Motion
From Surfrider's Blue Water Task Force to UNEP's global campaign — the organizations testing, protecting, and restoring our waterways.
Interceptor Solutions to Stop Plastic from Entering the Oceans
The Ocean Cleanup
Shows how river interceptors stop plastic at the source — 1,000 rivers cause 80% of river plastic reaching oceans
Watch on YouTube →Supporting Evidence (6 more)
The Most Polluted Beach In America
17-minute official deep-dive into Tijuana River pollution, health impacts on communities, and Surfrider's frontline solutions.
Stopping Ocean Plastic Pollution Starts with US
Ocean Conservancy presents their Science Advances study on U.S. coastal plastic pollution — peer-reviewed science driving policy solutions.
How We're Helping Our Planet's Freshwater
High-authority collaboration with the 'Our Planet' team bridging charismatic megafauna and essential freshwater conservation.
Watch on YouTube →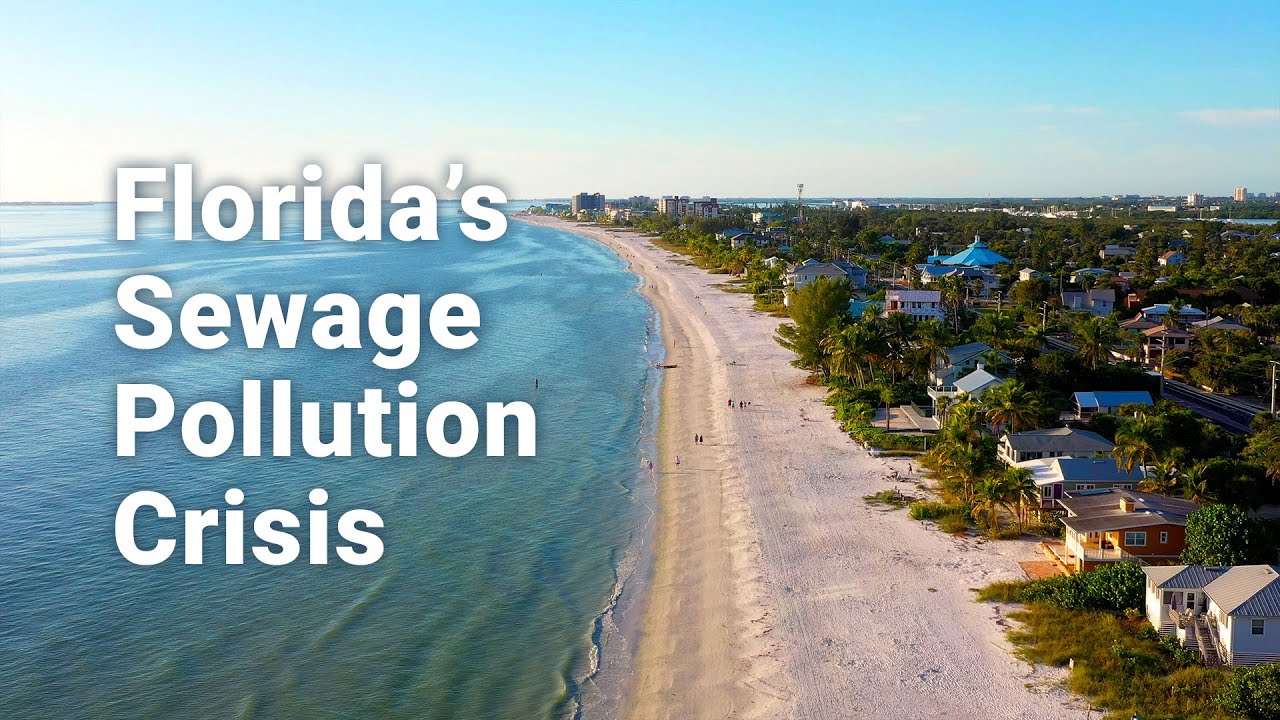
Florida's Sewage Pollution Crisis
17-minute deep-dive into how sewage contamination moves from local waterways to coastal ecosystems — authentic on-the-ground reporting from Surfrider.

Microplastic Pollution: New Research & Impacts on Communities
Waterkeeper's official webinar on microplastic research — the scientists who patrol the world's rivers share what they're finding in the water.

(PLASTIK) — A Wake Up Call to End Plastic Pollution
Official UNEP production using high-end cinematography to link individual consumption to global river and ocean health.
Frequently Asked Questions
- How does plastic get from rivers to the ocean?
- Rivers carry plastic waste from cities, farms, and landfills downstream to the sea. A 2017 Nature Communications study found that just 20 rivers — mostly in Asia — contribute 67% of all river plastic reaching the ocean. Interceptor technology and community cleanups are now targeting these key rivers.
- Which rivers contribute most to ocean pollution?
- The Yangtze, Ganges, Xi, Huangpu, and Mekong rivers are among the largest contributors of plastic pollution to the ocean. Research shows that 1,000 rivers account for roughly 80% of global river plastic emissions, concentrated in Asia, Africa, and South America.
- How does water pollution affect drinking water?
- Water pollution contaminates drinking water sources with microplastics, pharmaceuticals, heavy metals, and agricultural chemicals. As of 2020, 2 billion people lack safely managed drinking water. Waterborne diseases from contaminated sources kill hundreds of thousands of children annually.
- What can one person do about water pollution?
- Refuse single-use plastics, join local river or beach cleanups, support organizations like Ocean Conservancy or Waterkeeper Alliance, reduce household chemical use, and advocate for stronger water protection policies. Even small actions reduce the volume of pollutants entering waterways.
- How many ocean dead zones exist?
- Over 700 ocean dead zones have been identified globally as of 2021. These oxygen-depleted areas are primarily caused by nutrient runoff from agriculture and sewage, which triggers algal blooms that consume dissolved oxygen and make the water uninhabitable for most marine life.
- How can I test my local river or beach water?
- Surfrider Foundation's Blue Water Task Force trains volunteers to collect and test water samples at local beaches and rivers. You can also purchase basic water testing kits for bacteria, pH, and dissolved oxygen. Contact your local Waterkeeper organization for guided monitoring programs near you.
- What happens to plastic after it is removed from water?
- Collected macro-plastics are typically sorted for recycling (bottles, containers) or sent to waste management facilities. The bigger challenge is microplastics — fragments smaller than 5mm that cannot be effectively filtered from water. Prevention is far more effective than removal at this scale.
Research Sources
21 peer-reviewed papers + 1 scientific background source
View all 22 citations
Global threats to human water security and river biodiversity
Nature, 2010
Mapped threats to 65% of the world's river discharge, showing 80% of the world's population faces high water security threat
River plastic emissions to the world's oceans
Nature Communications, 2017
Found that 67% of global river plastic emissions come from just 20 rivers, mostly in Asia
Pharmaceuticals in the aquatic environment: A critical review
Journal of Hazardous Materials, 2020
Documented pharmaceutical contamination in rivers on every inhabited continent
Agricultural water pollution: key knowledge gaps and research needs
Current Opinion in Environmental Sustainability, 2017
Agriculture is the leading cause of water quality degradation globally, responsible for nutrient pollution creating ocean dead zones
Decline of the world's saline lakes
Nature Geoscience, 2017
More than half of the world's large saline lakes have shrunk since 1970, with water diversion as primary cause
Global river water quality under climate change and hydroclimatic extremes
Nature Reviews Earth & Environment, 2023
Climate change intensifies droughts and floods that worsen water pollution through concentration and flushing effects
The global ocean is an unrecognized sink for riverine organic carbon
Nature, 2022
Rivers transport massive amounts of organic matter to oceans, linking freshwater pollution directly to marine ecosystem health
Safe drinking water for all: what can we do?
The Lancet, 2022
2 billion people still lack safely managed drinking water services as of 2020
Marine dead zones: Causes, consequences and solutions
Science of the Total Environment, 2021
Over 700 ocean dead zones identified globally, primarily caused by nutrient runoff from agriculture and sewage
Microplastics in freshwater systems: A review
Water Research, 2018
Freshwater systems are both sinks and sources of microplastics, with concentrations comparable to marine environments
Water Quality: From the Source to the Sea
UN Environment Programme, 2024
Comprehensive UNEP assessment of global water quality trends, finding that water quality is deteriorating in most regions
The challenge of micropollutants in aquatic systems
Science, 2006
Schwarzenbach et al. foundational paper on how pharmaceuticals, hormones, and synthetic chemicals persist in water at concentrations that disrupt endocrine systems in fish and humans
Plastic waste inputs from land into the ocean
Science, 2015
Jambeck et al. quantified that 4.8-12.7 million metric tonnes of plastic enter the ocean annually from coastal populations — the definitive estimate of land-to-ocean plastic flux
Global threats to human water security and river biodiversity
Nature, 2010
Vörösmarty et al. showed that 80% of the world's population lives in areas where river water security is threatened — mapping the global intersection of human water needs and ecosystem health
Planetary boundary for novel entities exceeded: the case of PFAS
Environmental Science & Technology, 2022
Cousins et al. proved that PFAS contamination has exceeded the planetary boundary — rainwater globally now often exceeds safe drinking water guidelines. These 'forever chemicals' cycle between ocean, atmosphere, and land indefinitely
Life in the Plastisphere: microbial communities on plastic marine debris
Environmental Science & Technology, 2013
Zettler et al. discovered the 'Plastisphere' — a unique microbial ecosystem colonizing floating plastic that includes potential pathogens and invasive species. Plastic is not inert waste; it is a biological vector
Antibiotic resistance genes as emerging contaminants in water
Environmental Science & Technology, 2006
Pruden et al. established that antibiotic resistance genes are environmental contaminants — wastewater treatment plants amplify ARG abundance 100-1000x, creating downstream resistance hotspots
Developmental effects of endocrine-disrupting chemicals in wildlife and humans
Environmental Health Perspectives, 1993
Colborn et al. foundational paper establishing that synthetic chemicals at ng/L concentrations disrupt hormonal signaling in wildlife and humans — ethinyl estradiol effective at 0.1 ng/L while wastewater contains 1-10 ng/L
More than 1000 rivers account for 80% of global riverine plastic emissions
Science Advances, 2021
Meijer et al. mapped all river plastic sources globally — 1,656 rivers account for 80% of emissions, with the Yangtze (330,000 MT/yr), Ganges, and other Asian rivers dominating the flux to ocean
Collapse of a fish population after exposure to a synthetic estrogen
PNAS, 2007
Kidd et al. conducted the definitive whole-lake experiment: adding ethinyl estradiol at environmentally relevant concentrations (5 ng/L) caused complete reproductive failure and near-extinction of fathead minnows within 3 years
Plastic debris in the open ocean
PNAS, 2014
Cózar et al. discovered the 'missing plastic problem': 99% of ocean plastic particles are <5mm, but 80% of plastic mass is >5mm. The intermediate sizes are being fragmented into nanoplastics faster than they accumulate — with unknown biological consequences
Biogeochemical hotspots and hot moments for nutrient removal in streams and rivers
Nature Communications, 2017
Cheng & Basu quantified that constructed wetlands remove 90% of nitrogen when sized at 5% of watershed area — the engineering specification for nature-based water treatment at landscape scale
Continue Reading
More from Planetary Health

Shark Conservation: Overfishing Threats and Ecosystem Role
Shark conservation is critical as overfishing and finning threaten apex predators that regulate marine ecosystems. Learn evidence-based protection strategies and their ocean-wide impact.

Ocean Acidification: Impact on Shellfish and Marine Life
Ocean acidification disrupts shellfish physiology by lowering seawater pH, which impairs calcification processes in species like oysters and clams, leading to weakened shells and reduced fisheries yields. In juvenile...

Coral Bleaching and Mass Extinction: The Ocean Crisis
Coral bleaching is a stress response in reef-building corals caused by sea temperatures sustained at 1-2°C above seasonal averages, often exacerbated by El Nino events. This stress leads to the production of excess...
Share this article

Water Pollution: From Rivers to Oceans
Water pollution kills 1.8 million people yearly. Here are 10 things you can do, 5 organizations to support, and the peer-reviewed science behind rivers-to-oceans contamination.